Permutation tests
- Resampling is used without replacement
They are applied for general hypotheses tests:
\[ X_{1}, ..., X_{n} \sim F \quad \text{ and } \quad Y_{1}, ..., Y_{m} \sim G \\ H_{0} : F = G \quad \text{ vs.} \quad H_{1} : F \neq G \]
- Permutation tests can be performed to check for independence, homogeneity, tests for more than 2 groups, etc.
Let \(Z\) be the ordered set \(\{X_{1}, ..., X_{n}, Y_{1}, ..., Y_{m}\}\) indexed by the indices \(\nu = \{1, ..., n, n + 1, ..., n + m\} = \{1, ..., N\}\).
Under \(H_{0}\), the chance to select \(n\) elements of \(Z\) is
\[ \frac{1}{\binom{N}{n}} = \frac{n! m!}{N!}. \]
If \(\hat{\theta}(X, Y) = \hat{\theta}(Z, \nu)\) is a statistic, then the permutation distribution of \(\hat{\theta}^{*}\) is the distribution of the replicates
\[\begin{align} \left\{ \hat{\theta}^{*} \right\} &= \left\{ \hat{\theta}(Z, \pi_{j}(\nu)), j = 1, ..., \binom{N}{n} \right\} \\ & = \left\{ \hat{\theta}^{(j)} | \pi_{j}(\nu) \text{ is a permutation of } \nu \right\}. \end{align}\]The cdf of \(\hat{\theta}^{*}\) is given by
\[ F_{\theta^{*}}(t) = P(\hat{\theta}^{*} \leq t) = \binom{N}{n}^{-1} \sum_{j = 1}^{N} I\left( \hat{\theta}^{(j)} \leq t \right). \]
Thus, if \(\hat{\theta}\) is applied to test a hypothesis and large values of \(\hat{\theta}\) are significant, then the permutation test rejects the null hypothesis when \(\hat{\theta}\) is large relative to the distribution of the permutation replicates. The achieved significance level (ASL) of the observed statistic \(\hat{\theta}\) is the probability
\[ P(\hat{\theta}^{*} \geq \hat{\theta}) = \binom{N}{n}^{-1} \sum_{j = 1}^{N} I\left( \hat{\theta}^{(j)} \geq t \right), \]
where \(\hat{\theta} = \hat{\theta}(Z, \nu)\) is the statistic computed on the observed sample. The ASL for a lower-tail or two-tail test based on \(\hat{\theta}\) is computed in a similar way.
In practice, unless the sample size is very small, evaluating the test statistic for all of the \(\binom{N}{n}\) permutations is computationally excessive. An approximate permutation test is implemented by randomly drawing a large number of samples without replacement.
Approximate permutation test procedure
Compute the observed test statistic \(\hat{\theta}(X, Y) = \hat{\theta}(Z, \nu)\)ν).
For each replicate, indexed \(b = 1, ..., B\):
Generate a random permutation \(\pi_{b} = \pi(\nu)\).
Compute the statistic \(\hat{\theta}^{(b)} = \hat{\theta}^{*}(Z, \pi_{b})\).
If large values of \(\hat{\theta}\) support the alternative, compute the ASL (the em- pirical p-value) by
\[ \hat{p} = \frac{1 + \#\left\{ \hat{\theta}^{(b)} \geq \hat{\theta} \right\}}{B + 1} = \frac{ \left\{ 1 + \sum_{b = 1}^{B} I\left( \hat{\theta}^{(b)} \geq \hat{\theta} \right) \right\}}{B + 1}. \]
- Reject \(H_{0}\) at significance level \(\alpha\) if \(\hat{p} \leq \alpha\).
knitr::include_graphics("iBagens/permutation.png")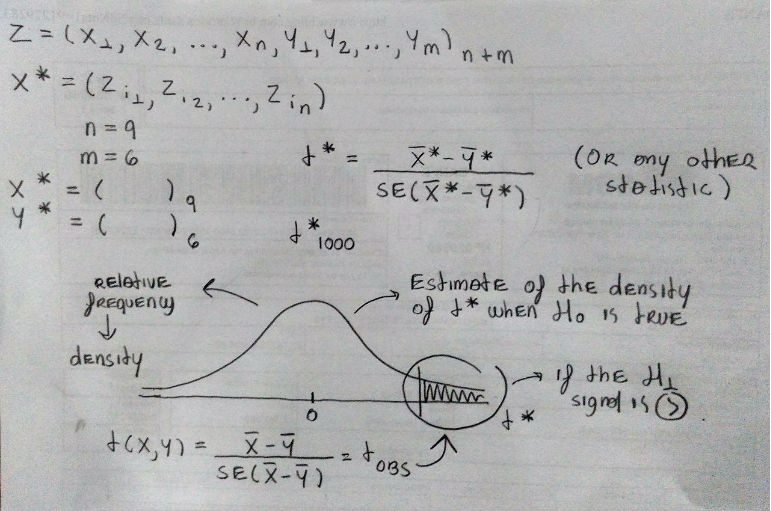
Figure 2: A representation of a permutation test.
Example 4 (Birth weight of chickens according 2 diets)
data("chickwts")

(x <- with(chickwts, sort(as.vector(weight[feed == "soybean"]))))
[1] 158 171 193 199 230 243 248 248 250 267 271 316 327 329(y <- with(chickwts, sort(as.vector(weight[feed == "linseed"])))) [1] 141 148 169 181 203 213 229 244 257 260 271 309r = 100
z = c(x, y)
k = length(z)
t.s = vector("numeric", r)
t = t.test(x, y)$statistic
for (i in 1:r){
ks = sample(k, size = length(x), replace = FALSE)
t.s[i] = t.test(z[ks], z[-ks])$statistic
}
(p <- mean(c(t, t.s) >= t))[1] 0.1188119